Lesson 32 - Text to diagram
In the previous session, we enabled the expression of connections between graphics, meaning we can now render many types of diagrams. Large models offer excellent support for numerous text-based diagramming languages, such as mermaid, D2, and draw.io.
Mermaid
Excalidraw provides the mermaid-to-excalidraw/api. If you're interested in its internal implementation, you can read the official documentation: How the Parser works under the hood ?
In summary, Excalidraw supports only a limited subset of Mermaid diagram types. It parses the SVG output from the Mermaid renderer, converts it into an internal scene diagram representation, and uses the Diagram JSON obtained from the parser to retrieve relationships between nodes.
Flowchart
Take the simplest Mermaid flowchart below as an example:
flowchart LR
 start-->stop
First, Mermaid's deprecated API is used to parse the text, extracting chart types, nodes, and edge relationships, but without geometric information:
import mermaid, { MermaidConfig } from 'mermaid';
const diagram = await mermaid.mermaidAPI.getDiagramFromText(definition); // "flowchart LR..."
Then use Mermaid's rendering method to render the SVG into a hidden container on the page. This also reveals the limitations of this approach: it can only be executed in a browser environment. Extract the node and edge geometric information from the rendered SVG output, using the node and edge IDs obtained in the previous step:
const { svg } = await mermaid.render('mermaid-to-excalidraw', definition);Finally, convert it into a scene graph accepted by our canvas, with text on nodes creating separate child nodes:
function convertFlowchartToSerializedNodes(
    vertices: Map<string, Vertex>,
    edges: Edge[],
    options: { fontSize: number },
): SerializedNode[] {
    vertices.forEach((vertex) => {
        // Vertex
        const serializedNode: SerializedNode = {
            id: vertex.id,
            type: 'rect',
            x: vertex.x,
            y: vertex.y,
            width: vertex.width,
            height: vertex.height,
            stroke: 'black',
            strokeWidth: 2,
        };
        // Label of vertex
        const textSerializedNode: TextSerializedNode = {
            parentId: vertex.id,
            content: getText(vertex),
            //...
        };
    });
    // Edges
}
Simply replacing the type of graphics can achieve hand-drawn style rendering:
nodes.forEach((node) => {
    if (node.type === 'rect') {
        node.type = 'rough-rect';
    } else if (node.type === 'line') {
        node.type = 'rough-line';
    } else if (node.type === 'text') {
        node.fontFamily = 'Gaegu';
    }
});
Sequence
[WIP] State
D2
Compared with Mermaid, D2 ships with a convenient parser out of the box.
import { D2 } from '@terrastruct/d2';

const d2 = new D2();
const { diagram, graph } = await d2.compile(definition);
const { connections, shapes } = diagram;
const {
    theme: { colors },
} = graph;x -> y: hello worldContainer
good chips: {
  doritos
  ruffles
}
bad chips.lays
bad chips.pringles

chocolate.chip.cookies
Connections
dogs -> cats -> mice: chase
replica 1 <-> replica 2
a -> b: To err is human, to moo bovine {
  source-arrowhead: 1
  target-arrowhead: * {
    shape: diamond
  }
}
drawio
A community parser is available:
import { parseDrawIO } from 'mxgraphdata';
const mxfile = await parseDrawIO(xml);
console.log(mxfile.diagram);
Edge label
Text labels on edges should stay at a well-chosen position along the geometry; we will cover a general approach in the next section Lesson 33 - Layout Engine. For this specific problem, it helps to compare how Excalidraw, tldraw, and draw.io handle it.
Separate node or attribute
In Excalidraw, placing text labels on edges (lines/arrows) isn't fundamentally about “making text follow paths or wrap along curves.” Instead, it relies on a simpler, more reliable approach:
- The label remains an independent text element (not rendered as part of the line itself).
- Bind the text to the line (arrow/line) in the data: the text records “which line it belongs to,” and the line records “its label text ID” or an equivalent relationship.
- Use geometric calculations to assign an anchor point to the text: typically the line's “midpoint” or a labelPosition parameter (0~1), then calculate the corresponding point based on the line's shape (straight/polygonal/curved).
- Treat text as a bound element: When the line moves, endpoints are dragged, kinks change, or arrows flip, the label's position is recalculated and text coordinates are updated (while handling line overlap avoidance, offset, and alignment).
tldraw takes a different approach: the label isn't a separate text shape but rather a prop (richText) of the arrow shape itself, combined with a set of geometric positioning and editing interactions.
In draw.io, placing text labels on edges (connectors) is one of its core capabilities. Its implementation aligns more closely with traditional flowchart editors: “Edges possess their own label (text) functionality, where labels exist as child states of the edge, with positions stored via geometric parameters/offsets,” rather than creating a separate text node and binding it.
Our implementation
We follow the Excalidraw-style model: edge copy is still a standalone text node, attached to the polyline via parentId, with edgeLabelPosition (0–1 along total polyline arc length) indicating where along the edge it sits.
export interface TextSerializedNode
  extends BaseSerializeNode<'text'>,
  Partial<TextAttributes>,
  Partial<{
    /**
     * When set, this text is an edge label: parent should be a bound polyline/line.
     * Value is 0–1 along total edge length (arc-length parameter).
     */
    edgeLabelPosition: number;
  }>;
Improving readability
Edge labels often need readability tweaks, especially to avoid sitting directly on top of the stroke.
Background fill
An opaque background can hide the line underneath.
- mxGraph (draw.io):
labelBackgroundColorstyle, e.g.labelBackgroundColor=whiteadds a white box behind the label.labelBorderColorcan add a border. - tldraw: arrow labels don't expose a dedicated background option, but text shapes support
showTextOutlinefor higher contrast. - Excalidraw: as standalone text elements,
backgroundColordraws a filled rectangle behind the text automatically.
Spacing and inset
Perpendicular offset and internal padding keep glyphs physically away from the stroke. We’ve added the edgeLabelOffset property, which, unlike edgeLabelPosition, uses absolute units to define the offset along the normal direction.
Automatic avoidance
Excalidraw and tldraw, as sketch-style tools, avoid heavy auto-layout for overlaps; users nudge labels by hand. mxGraph (draw.io), as a professional diagram editor, offers finer overlap control.
Text outline
A lighter alternative to a full background: stroke or shadow around glyphs for contrast. tldraw draws a thin outline behind text when showTextOutline enabled so it stays readable when overlapping.
We already introduce this method in Lesson 16 - Text stroke.
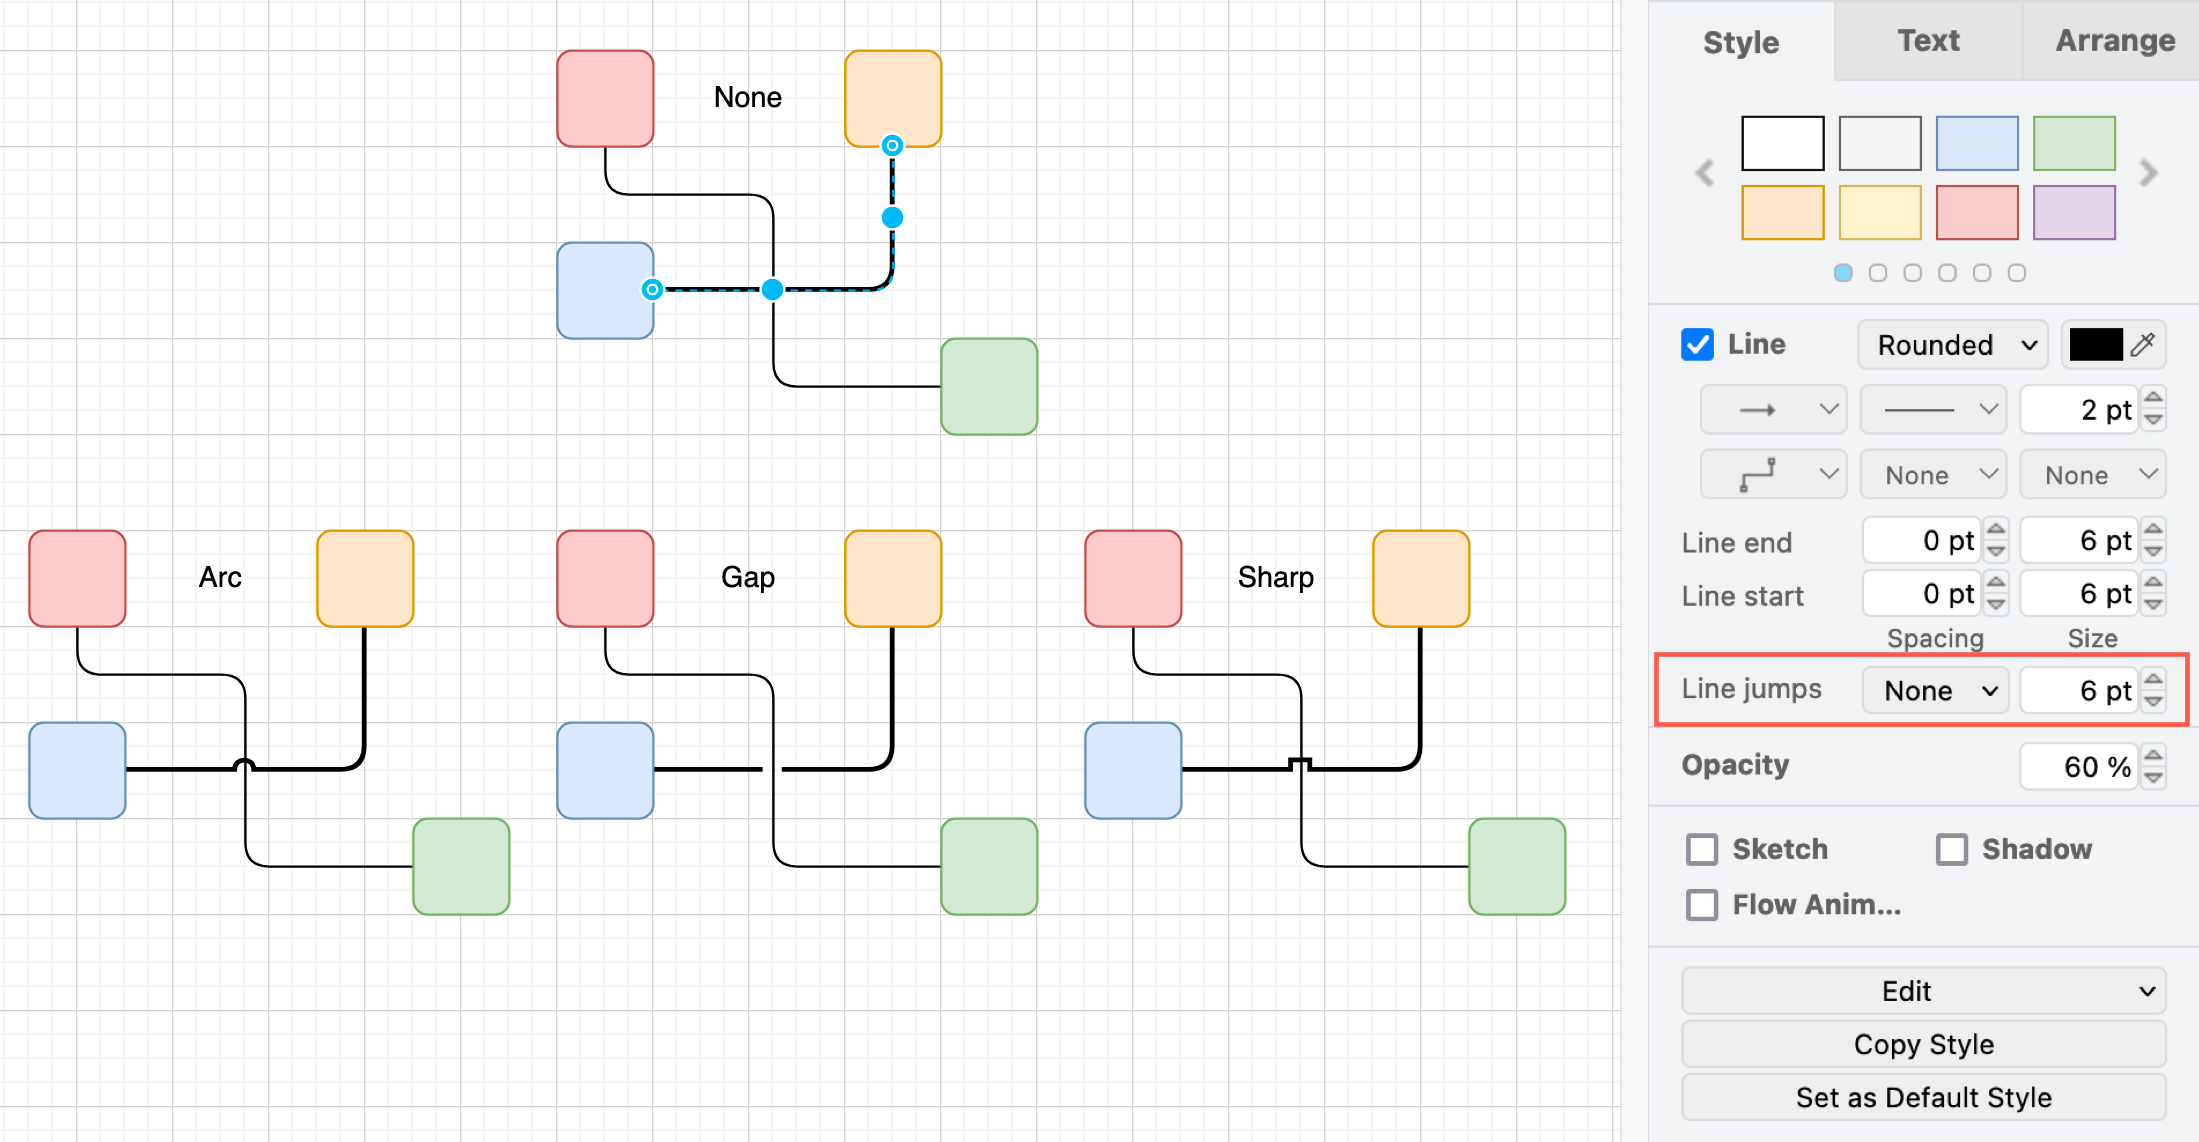
[WIP] Line jumps